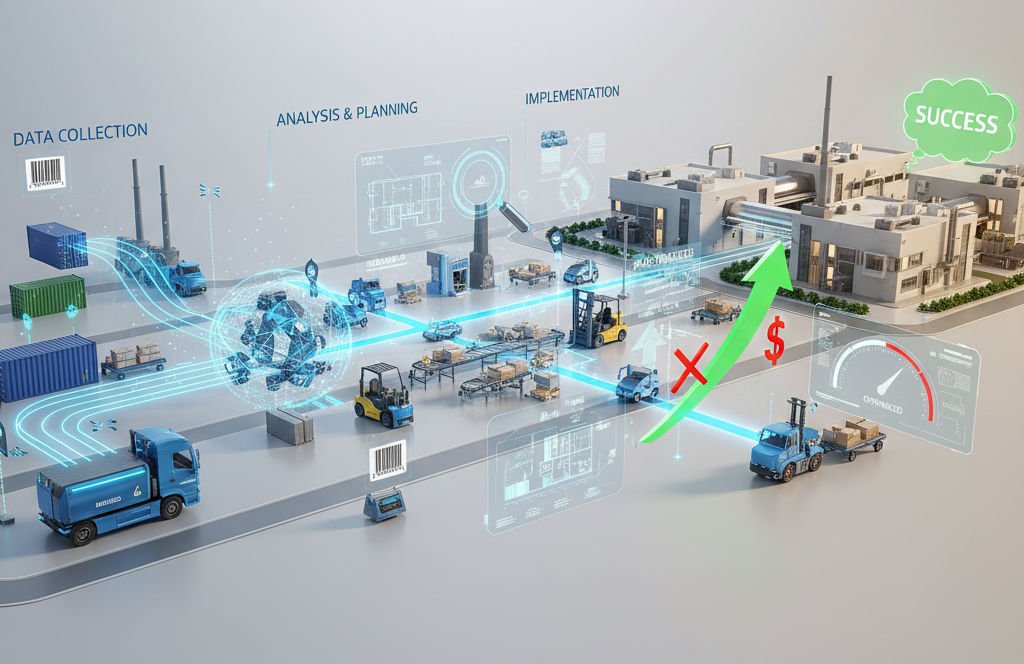
Material flow analysis: definition, objectives, methods and practical implementation
A stable, transparent material flow is the basis of any efficient production and intralogistics system. If parts, semi-finished products, containers or pallets are not in the right place at the right time, this results in downtime, search efforts, excess stock or expensive additional shifts. This is precisely where material flow analysis comes in.
Material flow analysis is the systematic recording and evaluation of all transport processes, storage and waiting times in the company with the aim of uncovering weak points in the material flow and making potential for improvement visible.
In this article, you will find out exactly what a material flow analysis is, what objectives it pursues, which methods and key figures are used in practice and what a typical procedure in industry and logistics looks like. You can also read about the role that material flow analysis plays in the decision to use forklift trucks, the classic tugger train or autonomous mobile robots (AMR) and how to avoid typical mistakes.
Table of contents:
What is a material flow analysis?
Material flow analysis is a logistics planning process that examines all movements and stays of materials within a defined system. For example, the following are considered
- Incoming and outgoing goods
- Storage and buffer areas
- Production and assembly zones
- Internal transportation routes and means of transport
The aim is to record transportation processes, storage and waiting times in full, display them graphically and evaluate them in terms of effort, costs and time.
A distinction is typically made between
-
Qualitative material flow
Transport relationships, their direction and sequence are shown, but without quantities. This reduced view helps to fundamentally understand complex networks.
-
Quantitative material flow
In addition to the transportation relationships, quantities, frequencies, times or costs are also stored. This makes it possible to identify particularly critical flows, such as large quantities over long distances.
The transparency gained in this way forms the basis for optimization measures, layout adjustments, automation solutions or investment decisions.
What are the objectives of a material flow analysis?
A material flow analysis always has several objectives at the same time. The most important ones include
Materials should run through the processes with as little waiting and idle time as possible.
Unnecessary transportation, detours or inefficient means of transport become visible and can be eliminated.
Bottlenecks in storage areas, overloaded transfer points or underutilized areas are identified.
Frequent disruptions, ad hoc transports or improvised emergency solutions are identified and replaced in a structured manner.
Objective decision-making bases for investments and automation projects are created instead of gut feelings.
Anyone planning new halls, converting existing areas or introducing transport robots needs a reliable basis for defining sensible routes, buffers and interfaces.
In short: a good material flow analysis answers the question of where and why material flows are unnecessarily expensive, slow or prone to faults today and how this can be systematically improved.
Which data and key figures are relevant?
In order for a material flow analysis to deliver reliable results, the right data must be collected and converted into meaningful key figures. Typical examples include
Master data and structural data
- Article and parts groups
- Packaging units and load carriers
- Layout data of halls, routes and storage areas
- Work plans, parts lists and routings
Movement data
- Transport quantities per article or article group
- Transport frequencies per source-destination relationship
- Distances covered per transport
- Means of transportation used (forklift, tugger train, transport robot, conveyor technology)
Time and inventory data
- Throughput times and idle times in buffer and storage areas
- Set-up and changeover times
- Stock levels and stock ranges
- Waiting times at bottlenecks, for example at machines or transfer points
Central key figures of the material flow analysis
- Transport intensity (quantity x frequency) between two stations
- Flow length (distance) between source and sink
- Handling frequency (how often a unit is reloaded or handled)
- Area productivity (handling or throughput per square meter)
- Throughput time from goods receipt to goods issue or delivery
Tools such as from-to matrices or distance-intensity diagrams present these key figures in a compact form. Material flows with high volumes over long distances are thus immediately visible and often highlight the most attractive starting points for optimization or automation measures such as the INDUROS autonomous transport robot.
How does a material flow analysis work step by step?
In practice, a multi-stage procedure that can be applied regardless of company size and industry has proven its worth:
-
Target definition and delimitation
It starts with a clear question:
- Should a single line be optimized or the entire site?
- Is it about transport costs, throughput time, space utilization or preparing for automation with transport robots?
- What are the economic targets, for example the desired cost reduction or capacity increase?
At the same time, the system boundary is defined, i.e. the area to be considered in the material flow analysis.
-
Recording the actual processes and layouts
In the next step, processes, stations and routes are recorded:
- Creating or updating hall and layout plans
- Identification of all quantity points (warehouse, machines, transfer points, incoming and outgoing goods)
- Documentation of transport routes and means of transport
This is often done through inspections, interviews on the store floor and evaluation of existing documents.
-
Data collection
Real transaction data is now determined. Sources include
- ERP, MES or BDE systems
- Transport order data from forklift control systems or fleet managers
- Manual counts, observations and time studies
- Tracking data from scanners, RFID systems or localization solutions
- Statistical data from a fleet manager or the software of an AMR
It is important to look at representative periods, such as several weeks including seasonal peaks.
-
Modelling and visualization
The collected data is processed in a structured manner, for example as:
- From-to matrix with quantities, times or costs per source-destination pair
- Material flow diagrams in layout (arrow diagram, block diagram, spaghetti diagram)
- Sankey diagrams for the visualization of quantity flows and main transports
This creates clear actual images that give all those involved the same view of the material flow.
-
Evaluation and identification of weak points
Based on this visualization, bottlenecks, waste and risks can be identified, for example:
- long distances with high transport volumes
- Frequent relocation, multiple handling of the same unit
- unnecessary return transports or crossing of routes
- unevenly utilized storage zones or transfer points
- Critical dependencies on individual means of transport or forklifts
The first areas for improvement are prioritized here.
-
Derivation of optimization measures and scenarios
Measures are developed from the identified weaknesses, such as
- Layout adjustments and shortening of routes
- Combining or separating certain storage areas
- Introduction of tugger trains for recurring tours
- Replacing manual forklift trips with transport robots or driverless transport systems
- Adaptation of batch sizes or staging concepts
Scenarios are often compared, for example "forklift operation" and "AMR automation".
-
Implementation and controlling
Finally, measures are prioritized, implemented and their impact tracked, for example with:
- Key figures such as throughput time, flow costs or inventory levels
- target/actual comparisons following the introduction of new transport technologies
- Regular re-analyses in the event of changes to the general conditions
This makes material flow analysis a recurring management tool, not a one-off project.
Which methods and tools are used in practice?
Classic lean methods and modern digital tools are combined in material flow analysis.
Qualitative methods
- Process recordings and gemba walks
Direct observation on site to understand real processes, detours and informal routines.
- Process mapping and flow charts
Visualization of processes, material flows and information flows in a simple, understandable form.
Lean method for visualizing the value stream, including material and information flows, in order to make waste in the process visible.
Quantitative methods
Tabular representation of material flows with quantities or transport frequencies between sources and sinks.
- Material flow matrices and distance-intensity diagrams
Combination of transportation intensity and distance to identify material flows with large quantities over long distances.
- ABC analyses and classifications
Focus on parts or flows with the greatest impact on costs or throughput.
Visual tools
Representation of the paths of a product or employee in the layout. Frequent crossings and loops are an indicator of waste.
Graphical representation of material flows in which the width of the arrows corresponds to the quantity transported. Particularly suitable for differentiating between main flows and secondary flows.
Digital tools and simulation
- Layout and planning tools
Software for creating and evaluating layout variants including material flows.
Discrete-event simulations in which real data is transferred to a model in order to test future scenarios, for example with changed quantities or the use of transport robots.
- Fleet managers and control systems
Even during operation, control systems for transport robots or AGVs provide valuable data for ongoing material flow analysis.
Typical use cases in production and intralogistics
Material flow analyses are always used when processes are complex or framework conditions change. Typical examples are
- New construction or expansion of production and logistics halls
Which areas belong together spatially, which routes should be short and where is automation worthwhile?
- Brownfield optimization of existing locations
Historically grown processes often lead to unnecessarily long distances, intermediate storage facilities and isolated solutions.
- Introduction of tugger trains or transport robots
Which routes are suitable for clocked tours, which for flexible autonomous systems?
- Conversion of the production strategy
For example, from line production to cell production, introduction of one-piece flow or increased use of just-in-time and just-in-sequence concepts.
- Growth, product change or higher variance
More variants and smaller batch sizes increase the demands on the material flow and make weak points visible.
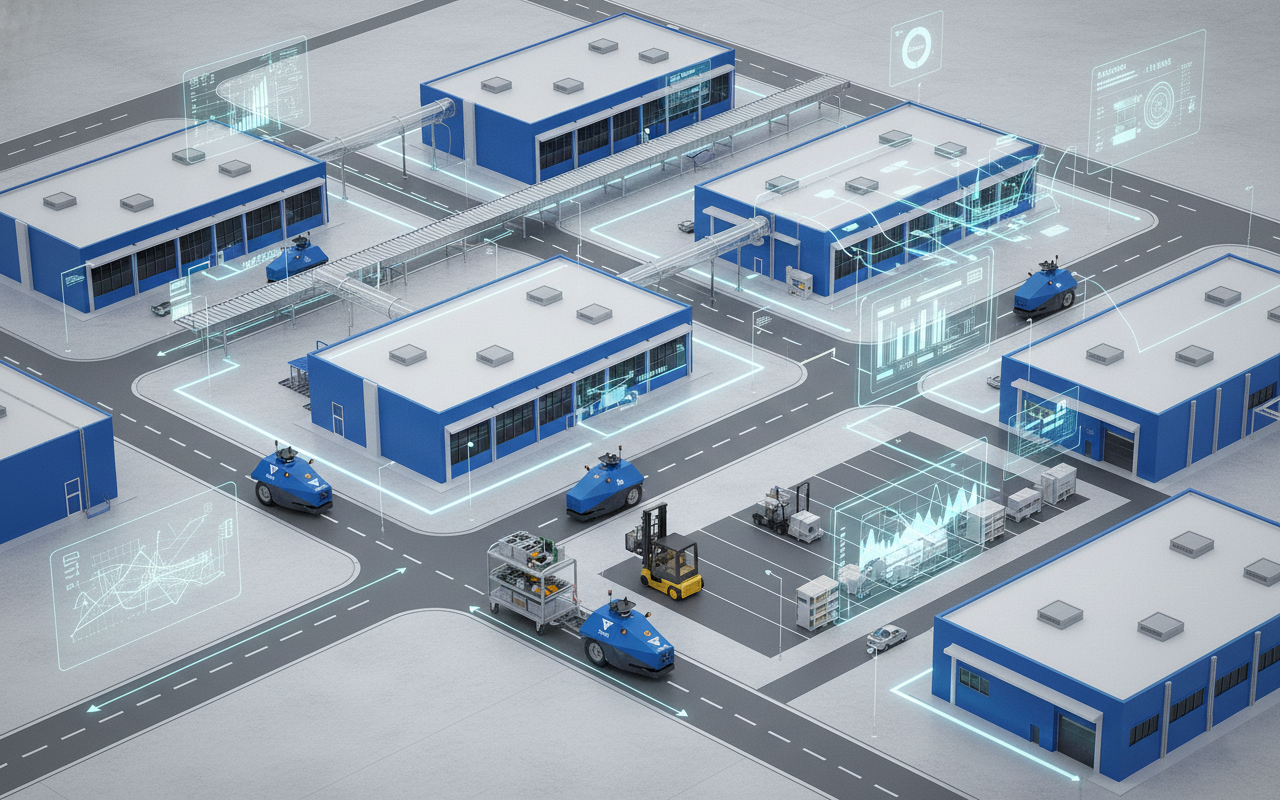
- Coupling indoor and outdoor material flows
Material flows across the factory premises, between halls or to outdoor warehouses, where weather influences, different floor qualities and safety requirements have to be taken into account, are particularly challenging. Autonomous transport robots such as an INDUROS can be a decisive success factor here, as this robot can drive autonomously both indoors and outdoors.
In these scenarios in particular, a proper material flow analysis determines whether subsequent automation with AGVs, tugger trains or autonomous mobile robots can develop its full potential.

Material flow analysis and automation with AGVs, tugger trains and AMRs
A material flow analysis not only answers the question of where improvements can be made, but also what type of transportation solution is suitable for this. It creates the basis for evaluating whether, for example, a tugger train, classic driverless transport systems or autonomous mobile robots are the best option.
Typically, the analysis shows:
- which routes are highly frequent and can be easily standardized
Route trains or clocked routes with an AGV or AMR are suitable here.
- where flexibility and dynamic routes are important
Autonomous mobile robots show their strengths in areas with frequently changing routes or individual transports triggered by employees.
- which transfer points, buffers and interfaces need to be planned
These include transfer points at machines, consolidation zones, loading ramps, incoming goods and outgoing goods.
- how indoor and outdoor material flows are connected
It becomes particularly exciting when material flows leave the building: Transportation between halls, across the yard, to outdoor warehouses or directly to outdoor production facilities. This is where traditional indoor solutions often reach their limits, while specially designed AMRs such as the INDUROS work reliably even on poor floors or in outdoor areas.
Ideally, the material flow analysis is the starting point of a roadmap, at the end of which there is scalable automation with the right combination of tugger train and autonomous mobile robots.
What does a material flow analysis cost and when does it pay off?
The costs of a material flow analysis depend in particular on
- Size and complexity of the system under consideration
- Scope of data collection (only system data or also manual surveys)
- Use of external consulting or purely internal implementation
- Use of simulation tools and digital planning tools
In practice, projects range from lean, focused analyses of individual lines to extensive location analyses with simulation. It is not so much the absolute project size that is of interest, but the ratio of project costs to savings achieved, for example through
- reduced throughput times and lower inventories
- Reduced transportation costs and fewer forklift trips
- higher system availability due to more stable material replenishment
- avoided bad investments in unsuitable transportation technology
- future savings through autonomous transport technology such as AMR
In many cases, material flow analysis and the measures derived from it pay for themselves within a few months to a few years, especially if they are linked to specific automation steps or layout improvements.
Five typical mistakes and how to avoid them
In order for a material flow analysis to unfold its full benefits, you should consciously avoid a few stumbling blocks:
- Unclear objectives and too large a scope
If objectives are not precisely defined, data is collected without focus and results remain abstract. Better: clearly defined areas and unambiguous target values.
- Only look at average values
Average throughput times or average transport volumes conceal peak loads and bottleneck situations. Also analyze peak loads, seasonal effects and special cases.
- Ignore manual transports and exceptional logistics
Many plants have "shadow logistics" consisting of spontaneous trips, emergency transports and detours. These must be taken into account, otherwise an important part of reality will remain invisible.
- Material flow analysis without involving employees
Data alone does not tell the whole story. Anyone who works with the material flow on a daily basis knows the causes and practical hurdles. Involve this expertise at an early stage.
- No consistent derivation of measures
A pretty diagram is useless if no decisions are made on the basis of it. Plan from the outset how measures are to be evaluated, prioritized and implemented, for example with regard to possible transport robots or tugger train concepts.
Conclusion: From the first as-is picture to intelligent, autonomous intralogistics
A material flow analysis is far more than just a snapshot of internal transportation. It creates transparency about routes, quantities, times and costs, uncovers weak points and provides a sound basis for investments in layout, organization and automation.
A systematic approach, clearly defined objectives and a combination of qualitative and quantitative methods can:
- Shorten throughput times
- Make better use of space and resources
- Reduce transportation costs
- Stabilize processes and make them easier to plan
- Prepare the transition to automated solutions with AGVs, tugger trains and autonomous mobile robots
This makes material flow analysis a strategic tool for companies that want to gradually raise their intralogistics to a higher performance level - from the first spaghetti sketch to highly automated, intelligently controlled material supply.
If you have already opted for an autonomous transport solution such as the AMR INDUROS, the experts at Innok will also be happy to help you calculate the individual benefits of switching to autonomous transport processes.