 Innok Robotics
Innok CEO Alwin Heerklotz at Robotics Day
On October 14, CEO Alwin Heerklotz will represent Innok Robotics at the digital Robotics Day hosted by *Robotik und Produktion* magazine.
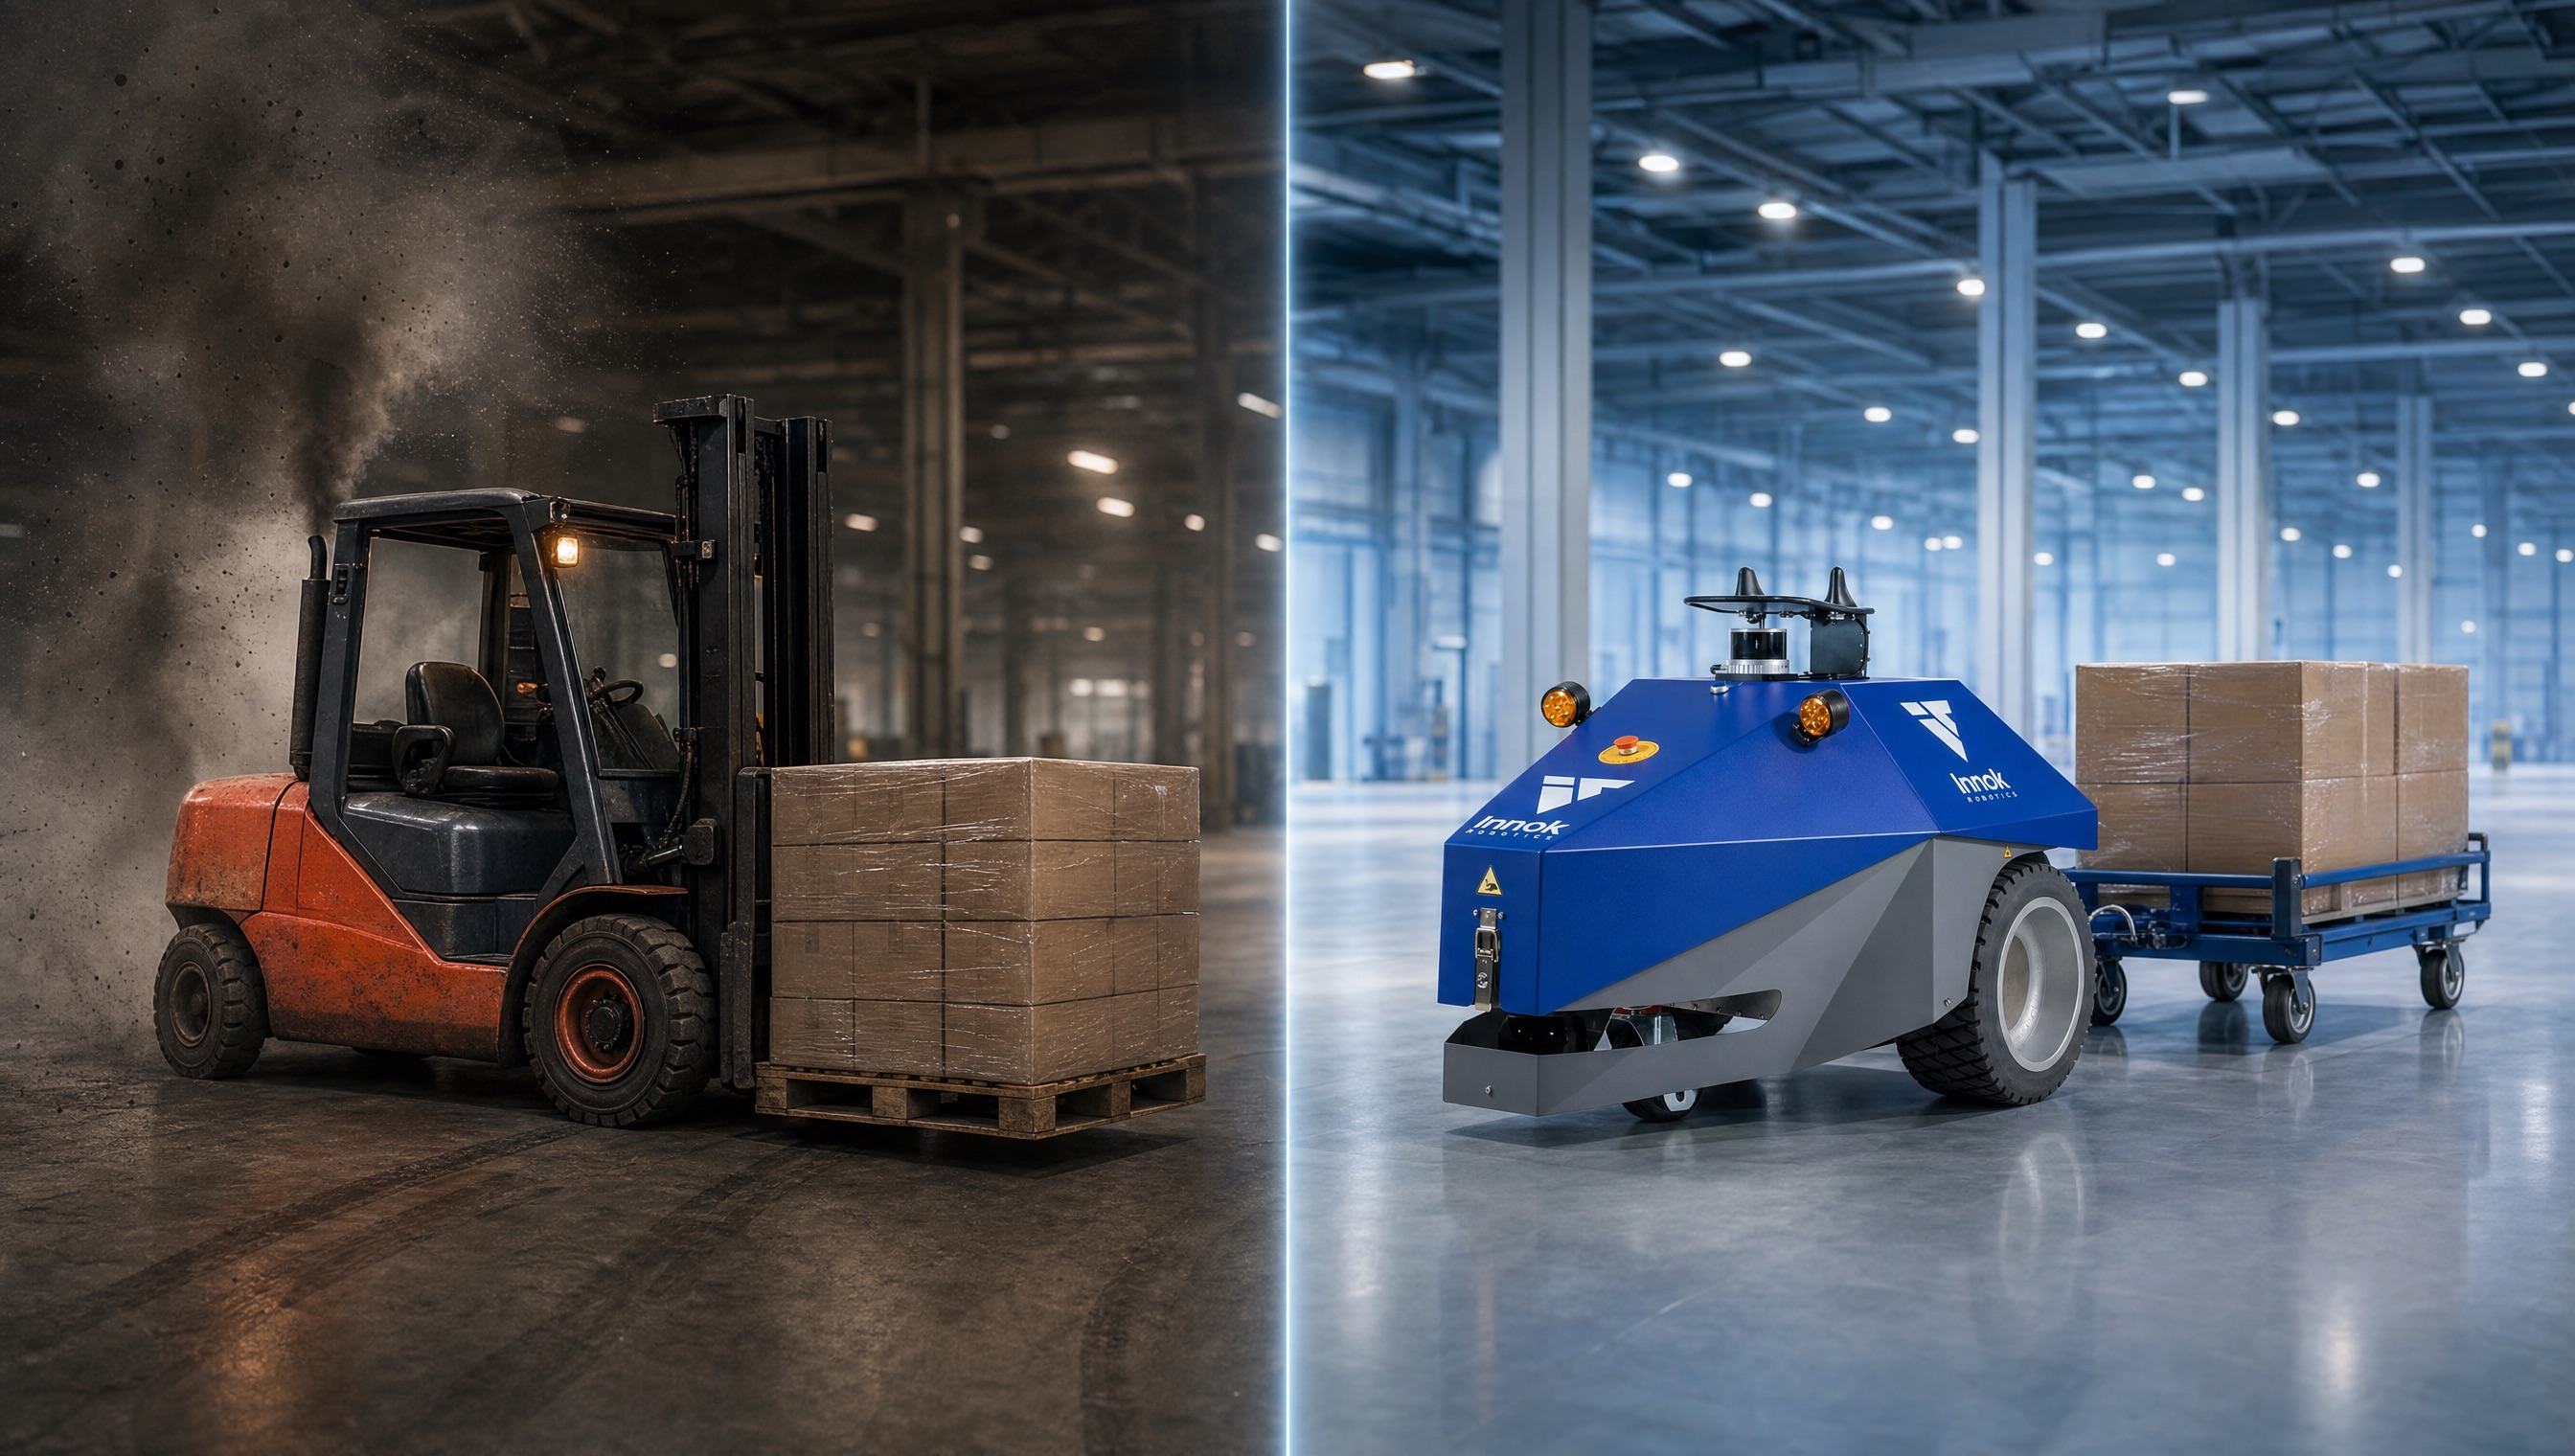
Reducing CO2 Emissions in Intralogistics: Where Emissions Occur and How Much Automation Really Helps
Emission factors, calculation examples, and realistic savings potential for logistics and sustainability managers
At a Glance
Those looking to reduce CO2 emissions usually focus on the vehicle fleet or building systems—and overlook their own intralogistics. Yet that is precisely where significant potential lies: A single diesel forklift emits approximately 13 to 24 metric tons of CO2 per year in two-shift operation. An electric forklift reduces this figure by about 86 percent, while an autonomous transport robot for material handling cuts it by around 98 percent. This overview shows where emissions arise in intralogistics, how you can calculate your fleet’s CO2 emissions yourself using official emission factors, what savings are realistic—and what you need to keep in mind to ensure the figures withstand an audit according to the CSRD and the GHG Protocol. All calculation methods are transparently documented and traceable.
1. Why Reducing CO2 Emissions Is Becoming Mandatory for Businesses
2. What Does Reducing CO2 Mean in Intralogistics?
3. Where do emissions occur in intralogistics—and within which scope?
4. What emission factors are used in the calculations?
5. How much CO2 does a forklift produce per day and per year?
6. A Comparison: Diesel Forklifts, Electric Forklifts, and Autonomous Transport Robots
7. How much CO2 can actually be saved?
8. Other Leverage Points Beyond the Powertrain
9. What to Keep in Mind When Calculating Your Carbon Footprint
10. FiveSteps to Achieving Reliable CO2 Savings
11. Conclusion
Reducing CO2 emissions is no longer just a voluntary public relations measure—it’s a business necessity. With the Corporate Sustainability Reporting Directive (CSRD), the EU requires companies subject to reporting obligations to disclose their climate-related impacts—across all three emission scopes of the Greenhouse Gas Protocol. If a company does not know its own emissions, it can neither report them nor reduce them.
The pressure is coming from several directions at once. Companies subject to reporting requirements are requesting emissions data from their suppliers because those emissions are factored into their own Scope 3 balance sheet. As a result, the issue is also affecting small and medium-sized businesses that are not themselves directly subject to the CSRD. A reliable carbon footprint is thus becoming a procurement criterion—and a low figure a competitive advantage.
At the same time, looking at the numbers makes economic sense. Every kilowatt-hour saved and every liter of diesel not used directly reduces operating costs. Reducing CO2 emissions and cutting costs are not opposites in intralogistics, but two sides of the same coin.
Intralogistics refers to the internal flow of materials and goods: all transport, storage, and order-picking processes within a plant or warehouse. Reducing CO2 in intralogistics therefore means lowering the greenhouse gas emissions generated by these internal processes—primarily from the powertrains of the vehicles used.
This area is often underestimated in carbon footprint assessments. While companies carefully track their vehicle fleets, heating systems, and road freight transport, forklifts and tow tractors within the facility are often categorized under “other operational consumption.” By way of comparison: Logistics accounts for about six percent of European CO2 emissions, and road freight transport causes about 30 percent of transportation emissions in Germany. The share attributable to internal operations may seem small by comparison—but that is precisely why it is an area where measurable success can be achieved with relatively little effort.
The key point: Unlike with supply chains or business travel, a company has complete control over its intralogistics. There are no external service providers whose data must first be painstakingly obtained. Consumption and emissions are directly measurable, directly controllable, and directly reportable.
For GHG Protocol accounting, correct categorization is crucial, as it determines how a change is reflected in the reporting:
This classification has an important practical implication. Anyone switching from diesel to electric shifts emissions from Scope 1 to Scope 2—and significantly reduces them in the process, because an electric drive achieves efficiencies of 85 percent, while diesel engines typically range from 30 to 35 percent. In addition, the Scope 2 share can be further reduced through electricity procurement, all the way to a net-zero-emission supply of certified green electricity. Diesel does not offer this possibility.
A second, often overlooked effect: Diesel forklifts emit not only CO2 but also nitrogen oxides and particulate matter. In enclosed warehouses, this requires a powerful ventilation system—which itself consumes electricity. Electric vehicles operate with zero local emissions and thus indirectly reduce the building’s energy consumption as well.
For a carbon footprint to be verifiable, the emission factors used must be disclosed. The following values are particularly relevant for intralogistics:
|
Energy sources |
Emission factor |
Application / Source |
|
Diesel (combustion, tank-to-wheel) |
2.64 kg CO2 / liter |
Direct vehicle emissions, Scope 1 |
|
Diesel (well-to-wheel) |
approx. 3.17–3.24 kg CO2e per liter |
Includes production, refining, and transportation (DIN EN 16258) |
|
Germany’s electricity mix in 2025 |
344 g CO₂ / kWh |
Federal Environment Agency (2024: 353 g, 2023: 379 g) |
|
Certified green electricity |
Net emissions close to 0 g/kWh |
Market-based accounting according to the GHG Protocol |
Two points to note here. First, the emissions factor of the German electricity mix is decreasing year by year—from 379 grams in 2023 to 344 grams per kilowatt-hour in 2025. This means that every electrically powered machine automatically becomes more climate-friendly with each passing year, without any changes needing to be made to its operation. A diesel vehicle, on the other hand, maintains the same emission factor indefinitely.
Second, you should clearly specify whether you are using a tank-to-wheel or well-to-wheel calculation. Burning one liter of diesel releases 2.64 kilograms of CO2; when extraction, refining, and transportation are factored in, the total is approximately 3.2 kilograms. The following calculation examples consistently use the more conservative tank-to-wheel approach. When using a well-to-wheel assessment, the advantage of electric powertrains becomes even more pronounced.
This question cannot be answered with a single number, as emissions depend heavily on the load, the surface, the load cycle, and driving style. Therefore, the only reliable answer is a range—with a clearly stated example value included within it.
Industry sources cite a fuel consumption of about 1.7 liters per hour for equipment in this class; for forklifts under 2.5 metric tons, the range is 2 to 3 liters per hour. Values of 3 to 4 liters generally apply to 5-metric-ton forklifts. For 12 operating hours, this results in a realistic range of 20 to 36 liters per day.
Conservative calculation example: 2 .0 L/h × 12 h = 24 liters per day. At 2.64 kg of CO2 per liter, that amounts to 63 kg of CO2 per day. Assuming 250 days of operation per year: 6,000 liters of diesel and approximately 15.8 metric tons of CO2—per vehicle.
For electric forklifts in this class, consumption is specified at 12 to 22 kilowatt-hours per eight-hour shift, which corresponds to 1.5 to 2.75 kilowatt-hours per hour. Over 12 hours, this amounts to 18 to 33 kilowatt-hours per day; with very intensive use and intermediate charging, consumption can reach up to 48 kilowatt-hours. The frequently cited annual consumption of 5,000 to 8,000 kilowatt-hours confirms this range.
Conservative calculation example: 2 .2 kWh/h × 12 h = 26 kWh per day. At 344 g of CO2 per kilowatt-hour, that amounts to about 9 kg of CO2 per day, or 6,500 kWh per year and approximately 2.2 metric tons of CO2.
An autonomous mobile transport robot in this performance class pulls trailers with payloads ranging from several hundred to about 1,300 kilograms and can operate for a full workday on a 48-volt battery with a capacity of about 2.9 kilowatt-hours. The drive system typically delivers 2 × 400 watts, resulting in an average power consumption of about 240 watts over twelve hours.
Calculation example: 2 .9 kWh per day corresponds to about 1.0 kg of CO2 per day. Over the course of a year, that amounts to 725 kWh and about 0.25 metric tons of CO2—a fraction of what a forklift emits.
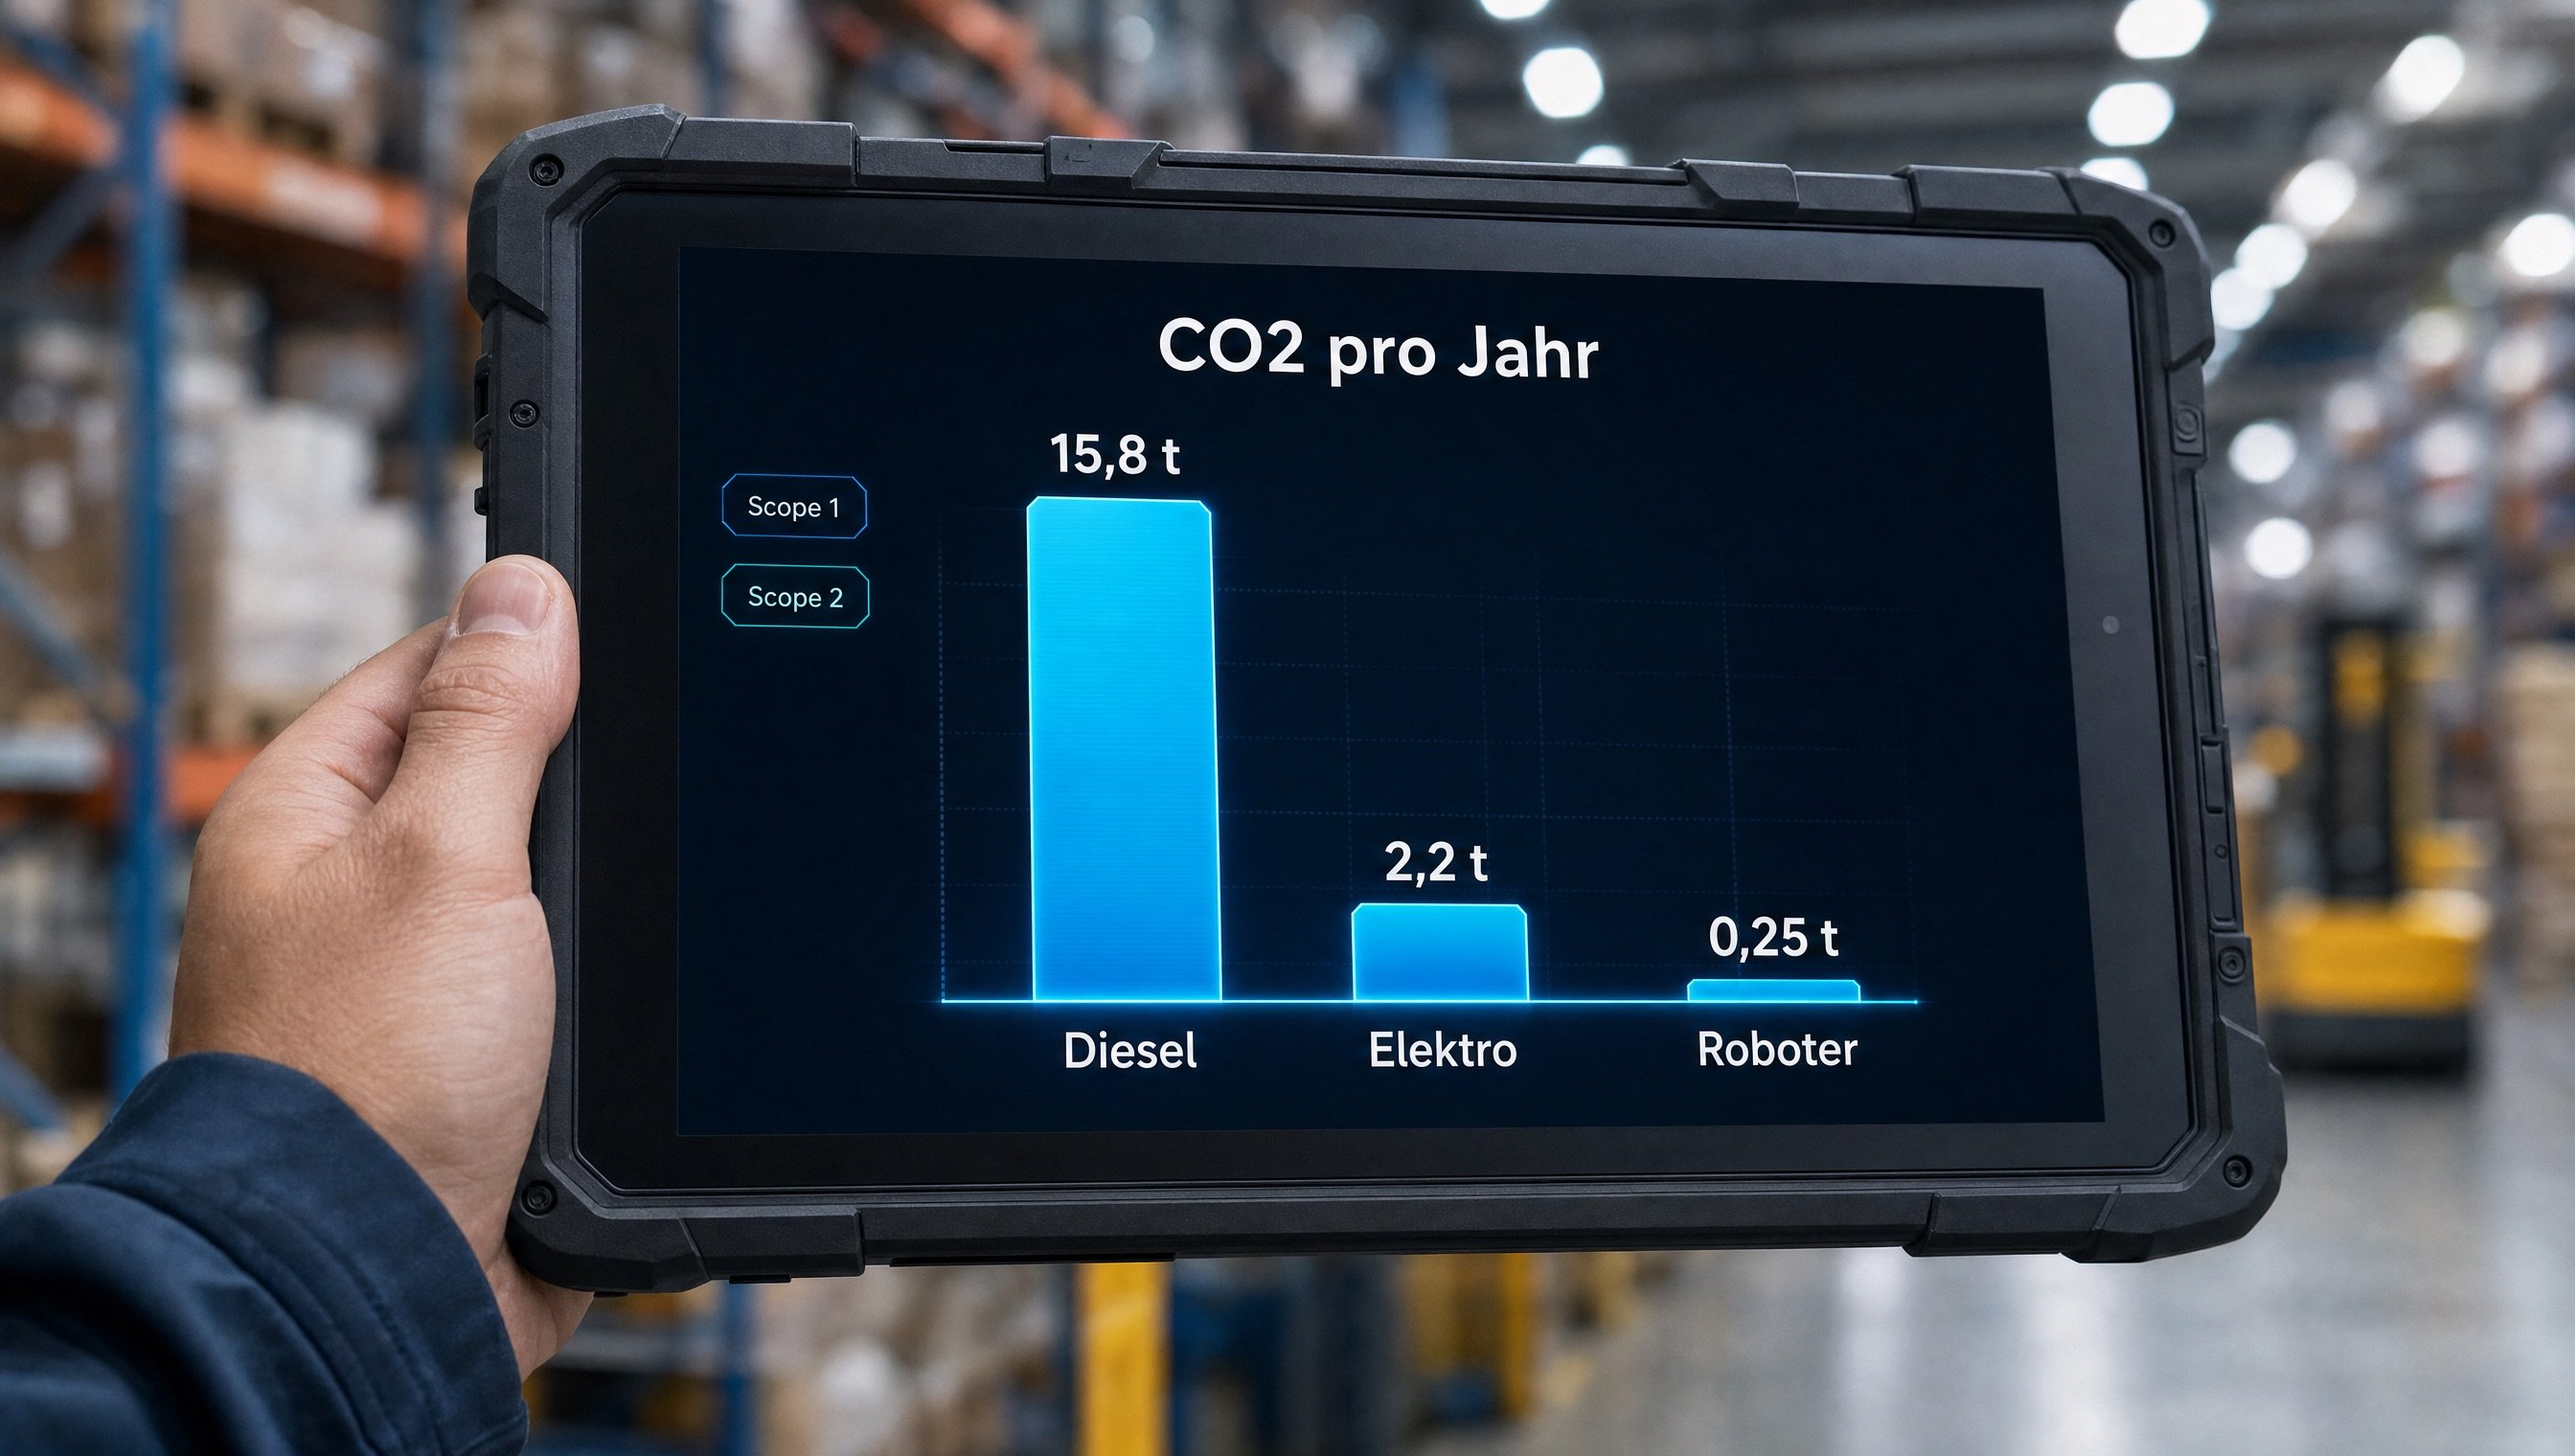
The following overview compares all three powertrain concepts. The realistic range is specified for each, with the conservative example value from the previous section shown in parentheses. Assumptions: 12 operating hours per day, 250 operating days per year, Germany’s 2025 electricity mix, diesel tank-to-wheel.
|
Vehicle Type |
Energy / Day |
CO2 / Day |
CO2 / Year |
Savings |
|
1.5-metric-ton diesel forklift |
20–36 L (24 L) |
53–95 kg (63 kg) |
13.2–23.8 t (15.8 t) |
Reference |
|
Electric forklift 1.5 t |
18–48 kWh (26 kWh) |
6–17 kg (9 kg) |
1.5–4.1 metric tons (2.2 metric tons) |
approx. 86% |
|
Autonomous transport robot |
approx. 2.9 kWh |
approx. 1 kg |
approx. 0.25 metric tons |
approx. 98% |
Two findings stand out. First, simply switching from diesel to electric reduces emissions by about 86 percent—which is consistent with real-world reports that cite reductions of 80 to 90 percent for the switch to electric forklifts. Second, the autonomous transport robot is significantly lower still: compared to the electric forklift, it saves about 89 percent, and compared to the diesel forklift, about 98 percent.
In practice, the key factor is the annual and fleet-wide projection. If a diesel forklift—which is primarily used for transport tasks—is replaced by an autonomous transport robot, a conservative estimate shows a reduction of approximately 15.6 metric tons of CO2 per year per vehicle. Across the entire range, the savings amount to 13 to 23.5 metric tons.
With five vehicles replaced, this adds up to about 78 metric tons of CO2 per year—in the conservative scenario. To put this in perspective: This roughly corresponds to the annual emissions of about seven average households in Germany. If the robot is charged with certified green electricity, the Scope 2 emissions effectively drop to zero, and the reduction approaches 100 percent.
These figures are not isolated cases. Industry statistics show that in 2022, 30,000 mobile robots worldwide saved approximately 140,000 metric tons of CO2 and 16 million kilowatt-hours of energy. And that a company with 20 forklifts will, through electrification, require 50,000 to 100,000 kilowatt-hours less energy annually and reduce emissions by up to 40 metric tons.
Important: A transport robot does not replace a forklift in its core function—lifting and stacking. However, it does replace purely transport-related trips—and in many companies, these account for the majority of a forklift’s operating time. In documented real-world cases, one employee spent about seven hours a day exclusively transporting materials with a forklift. It is precisely this portion that can be replaced, and it is precisely this that a serious cost-saving analysis should focus on.
The vehicle’s energy consumption is the most obvious factor, but not the only one. Automated intralogistics reduces the carbon footprint on multiple levels simultaneously:
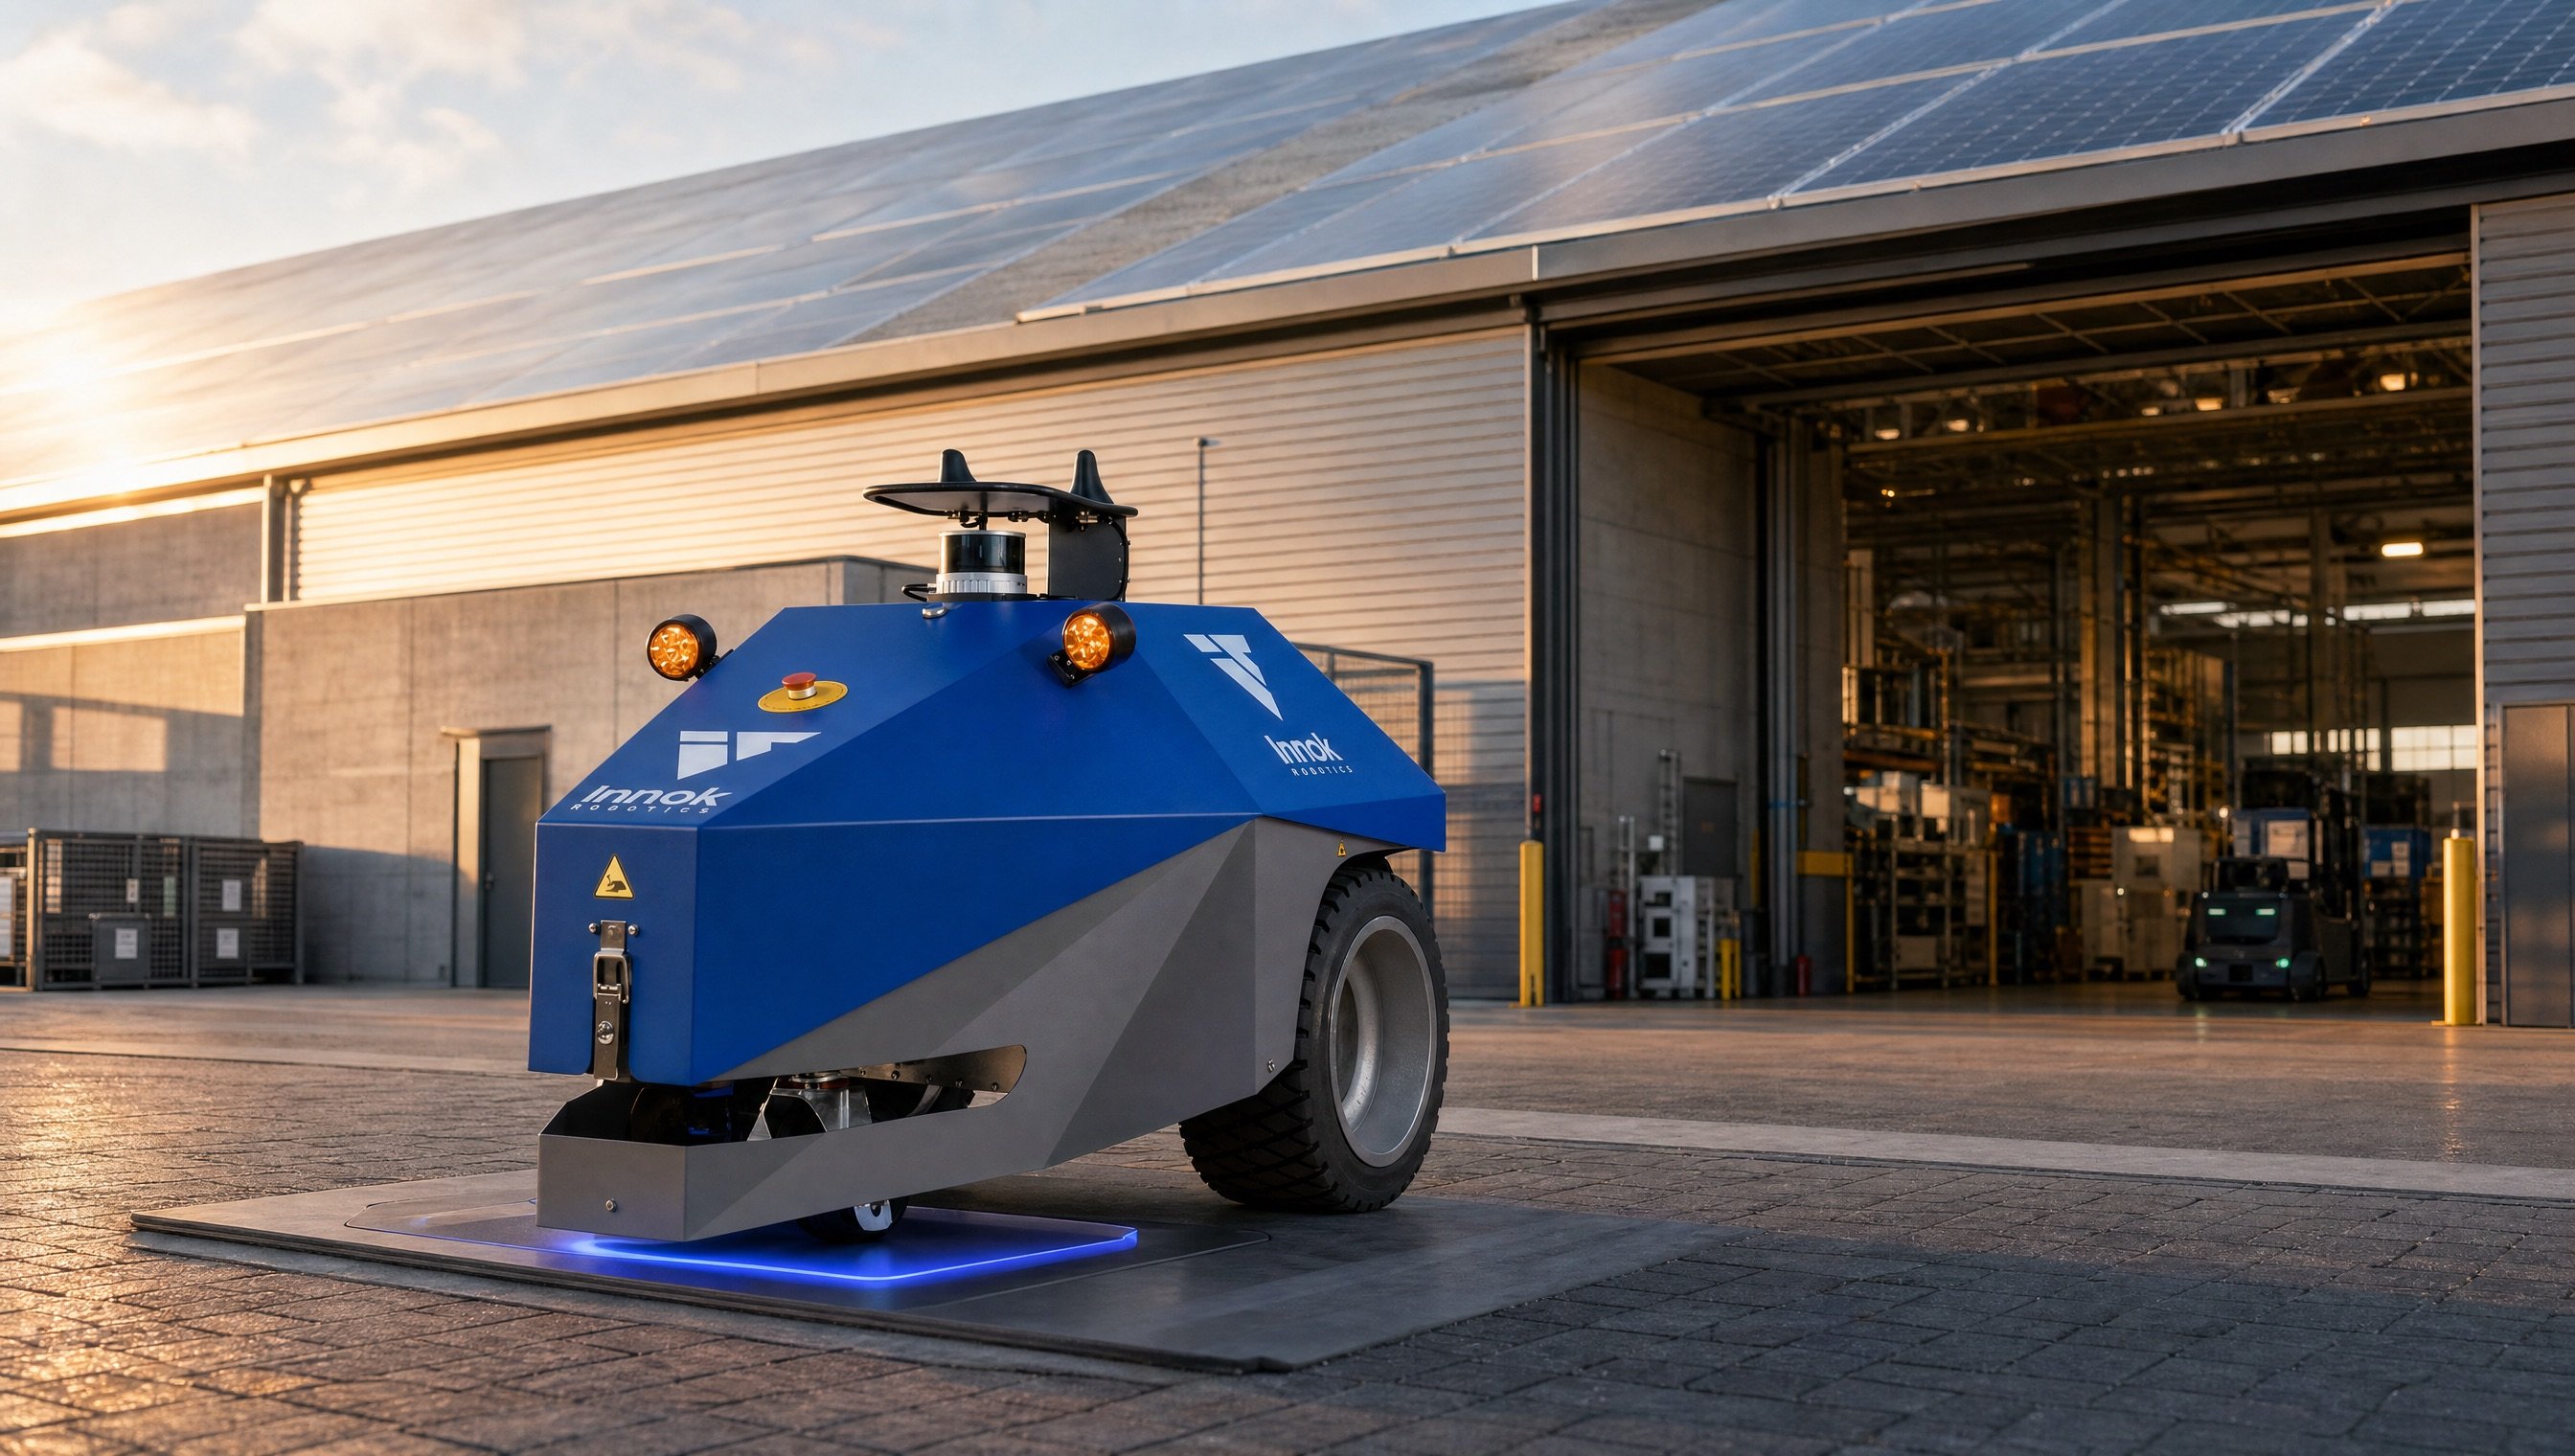
Wireless charging and automatic recharging between jobs also ensure that batteries remain within the optimal charging window. This extends their service life and reduces the need for replacement—another factor contributing to the overall environmental footprint.
A CO2 calculation is only as good as its assumptions. These five points determine whether your figures will stand up to scrutiny:
Another common mistake involves the battery manufacturing process. It does indeed generate emissions that fall under Scope 3. However, for vehicles with a service life of several years and several thousand operating hours, these upfront emissions are offset in a short time by ongoing operation—whereas for a diesel vehicle, emissions remain consistently high.
This approach has a pleasant side effect: The data collected for this purpose is exactly what you need for a cost-benefit analysis anyway. The carbon footprint and return on investment are calculated in a single step.
Anyone who needs to reduce CO2 emissions—and isn’t just interested in making a symbolic gesture—should take a close look at their own intralogistics. Emissions in this area can be directly measured, are entirely within one’s own control, and can be reported without involving third parties. A single diesel forklift emits 13 to 24 metric tons of CO2 per year in two-shift operation. Switching to an electric forklift reduces this by about 86 percent, while shifting purely transport-related trips to an autonomous mobile robot reduces it by about 98 percent—and with green electricity, the reduction is practically complete.
The methodology is crucial for credibility: compare the same work output, disclose system boundaries, use current emission factors, and think in terms of ranges rather than exact values. Calculations made this way will withstand any audit under the CSRD and the GHG Protocol—and at the same time provide the necessary arguments for the investment decision.
With the INDUROS, Innok Robotics is developing an autonomous transport robot that addresses precisely this need: fully electric drive, payloads of up to 1,300 kilograms, inductive recharging between jobs, and seamless operation between the warehouse and outdoor areas—without any changes to the existing infrastructure. In documented real-world cases, it thus replaces exactly those forklift hours that were previously spent exclusively on material transport.
You can determine whether this approach makes financial sense for your business with minimal effort: record the operating hours and fuel consumption of your current fleet, determine the proportion of time spent on transport, and compare both figures with the values shown here. In most cases, just a few hours of analysis is enough to show how many metric tons of CO2 and how much in operating costs are actually at stake each year. When labor costs are factored in, the ROI (return on investment) for the AMR is often achieved in less than two years .
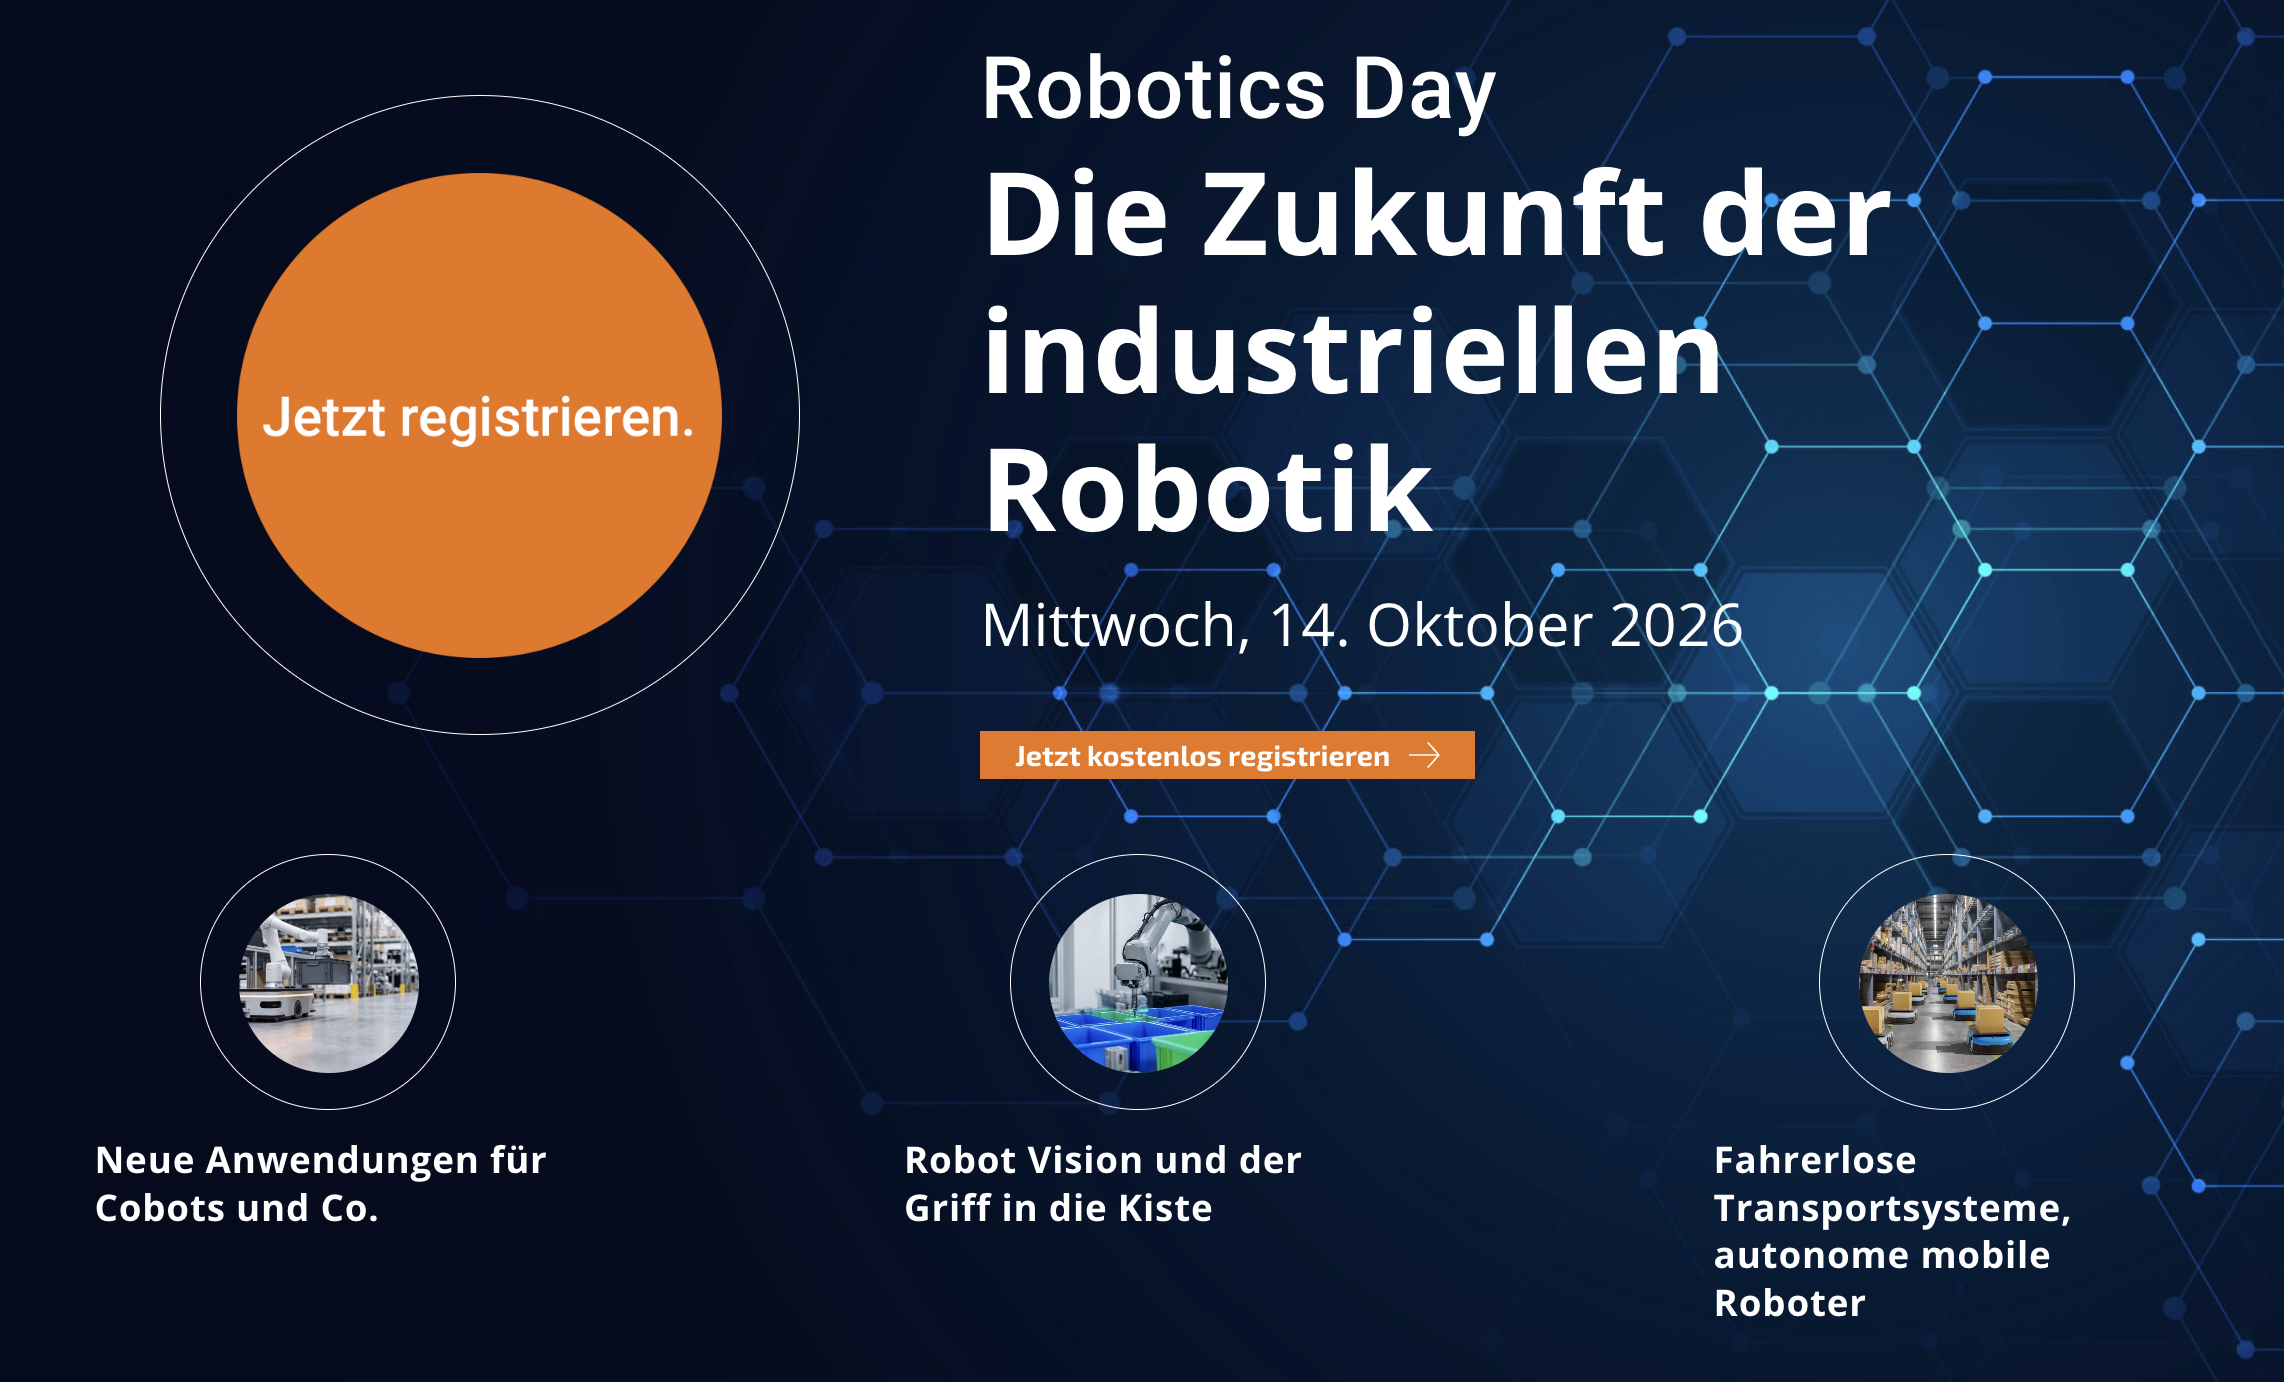
On October 14, CEO Alwin Heerklotz will represent Innok Robotics at the digital Robotics Day hosted by *Robotik und Produktion* magazine.
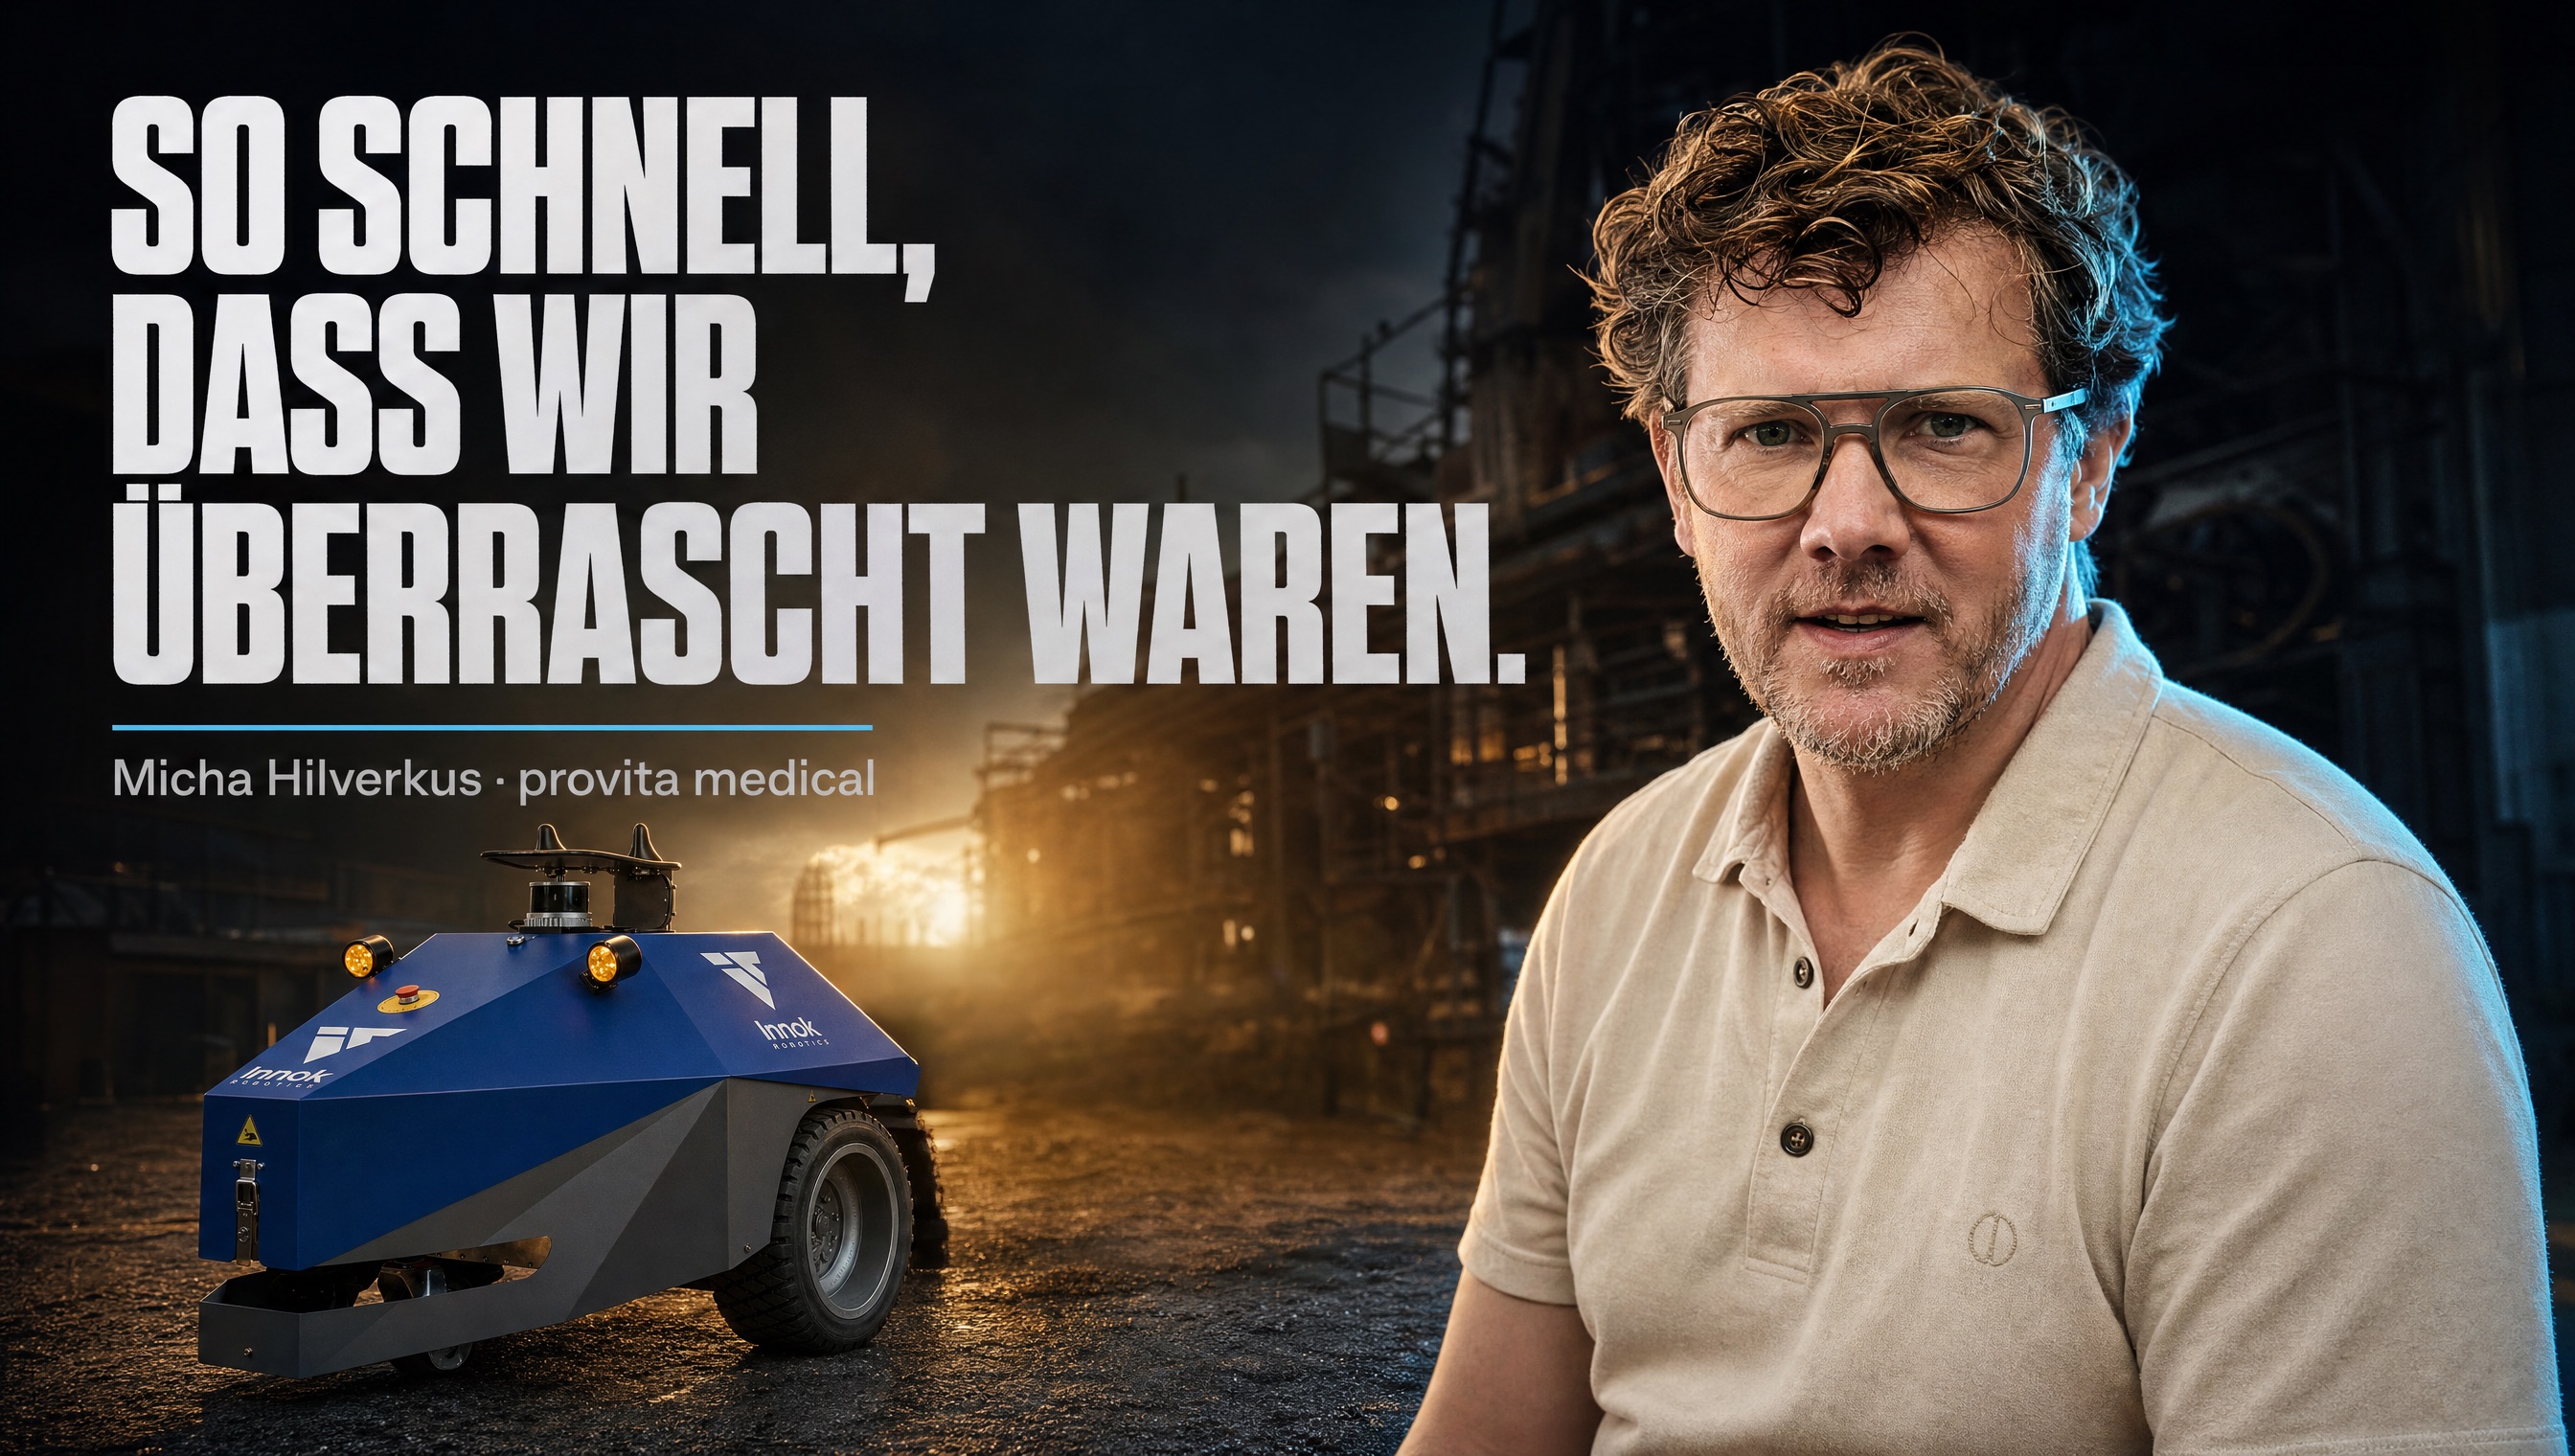
The Latest Innok Case Study: INDUROS Automates Cross-Plant Logistics at provita medical
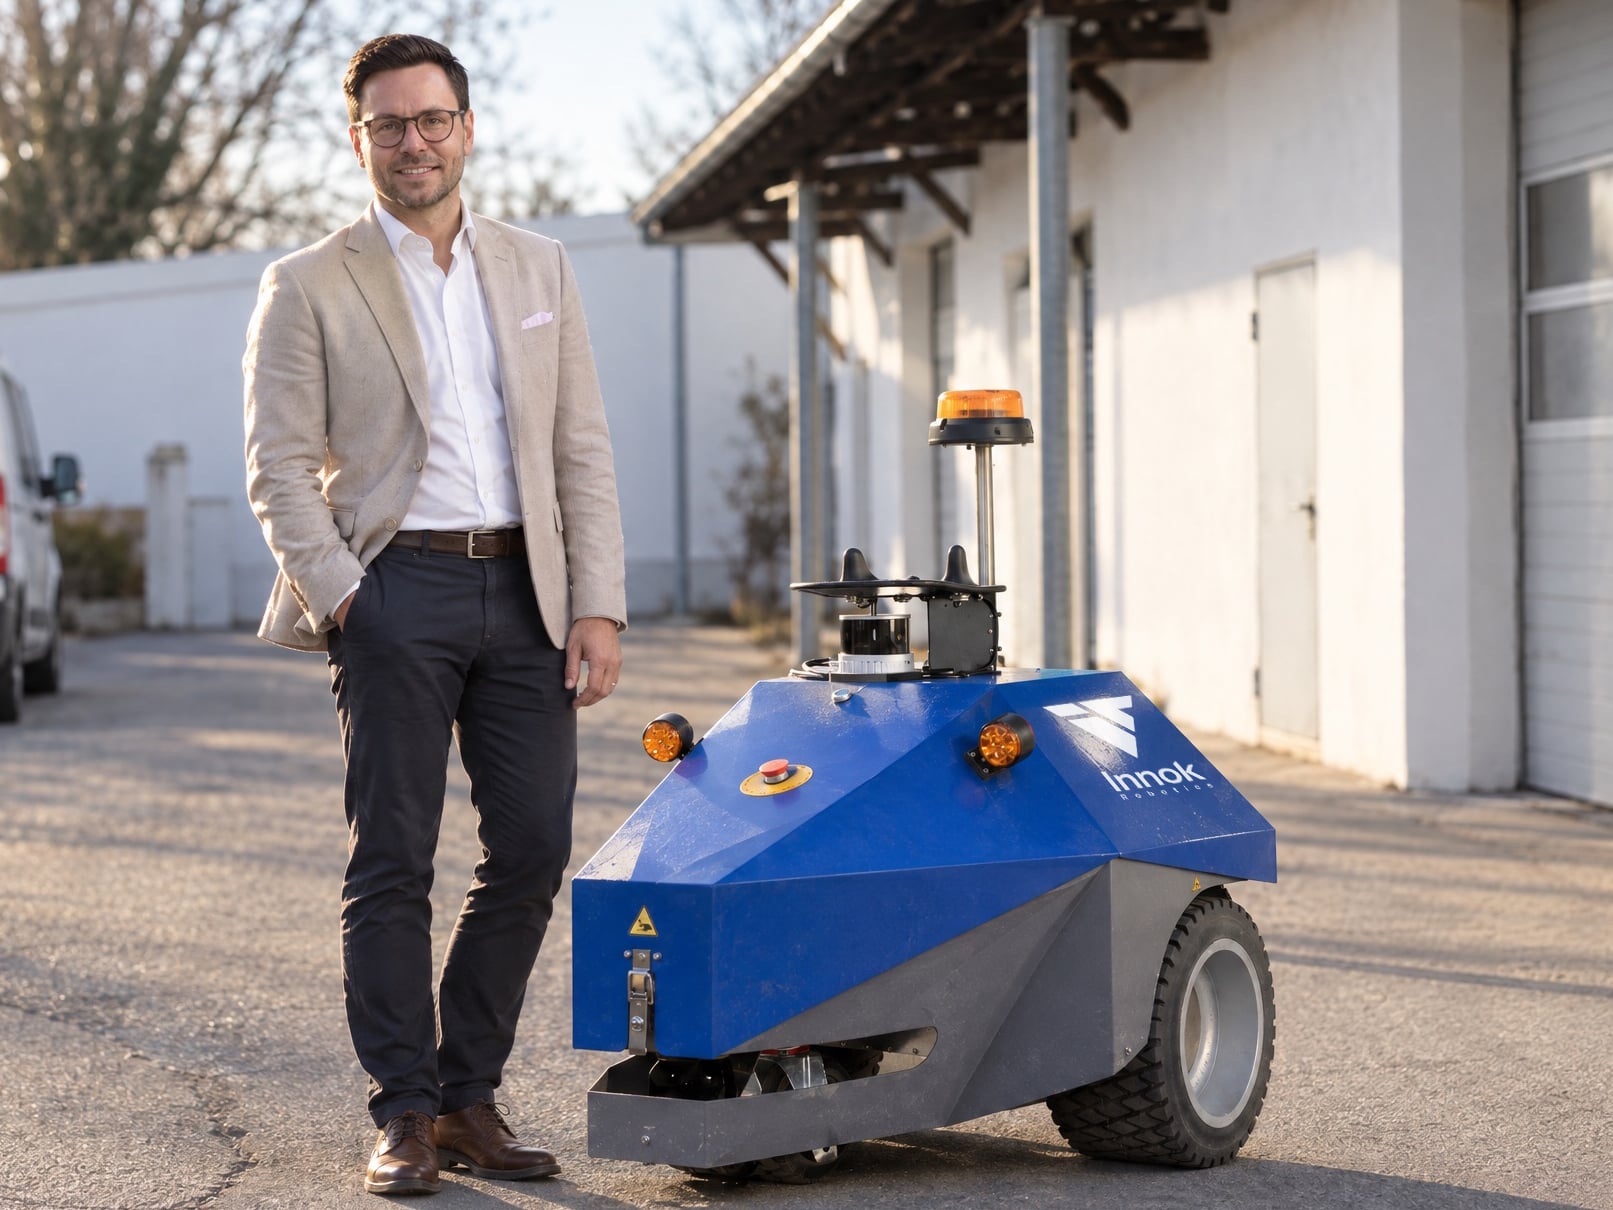
Innok Robotics GmbH Expands Executive Management: Michael Hanselmann Joins as Chief Financial Officer (CFO) Ahead of Planned Initial Public Offering